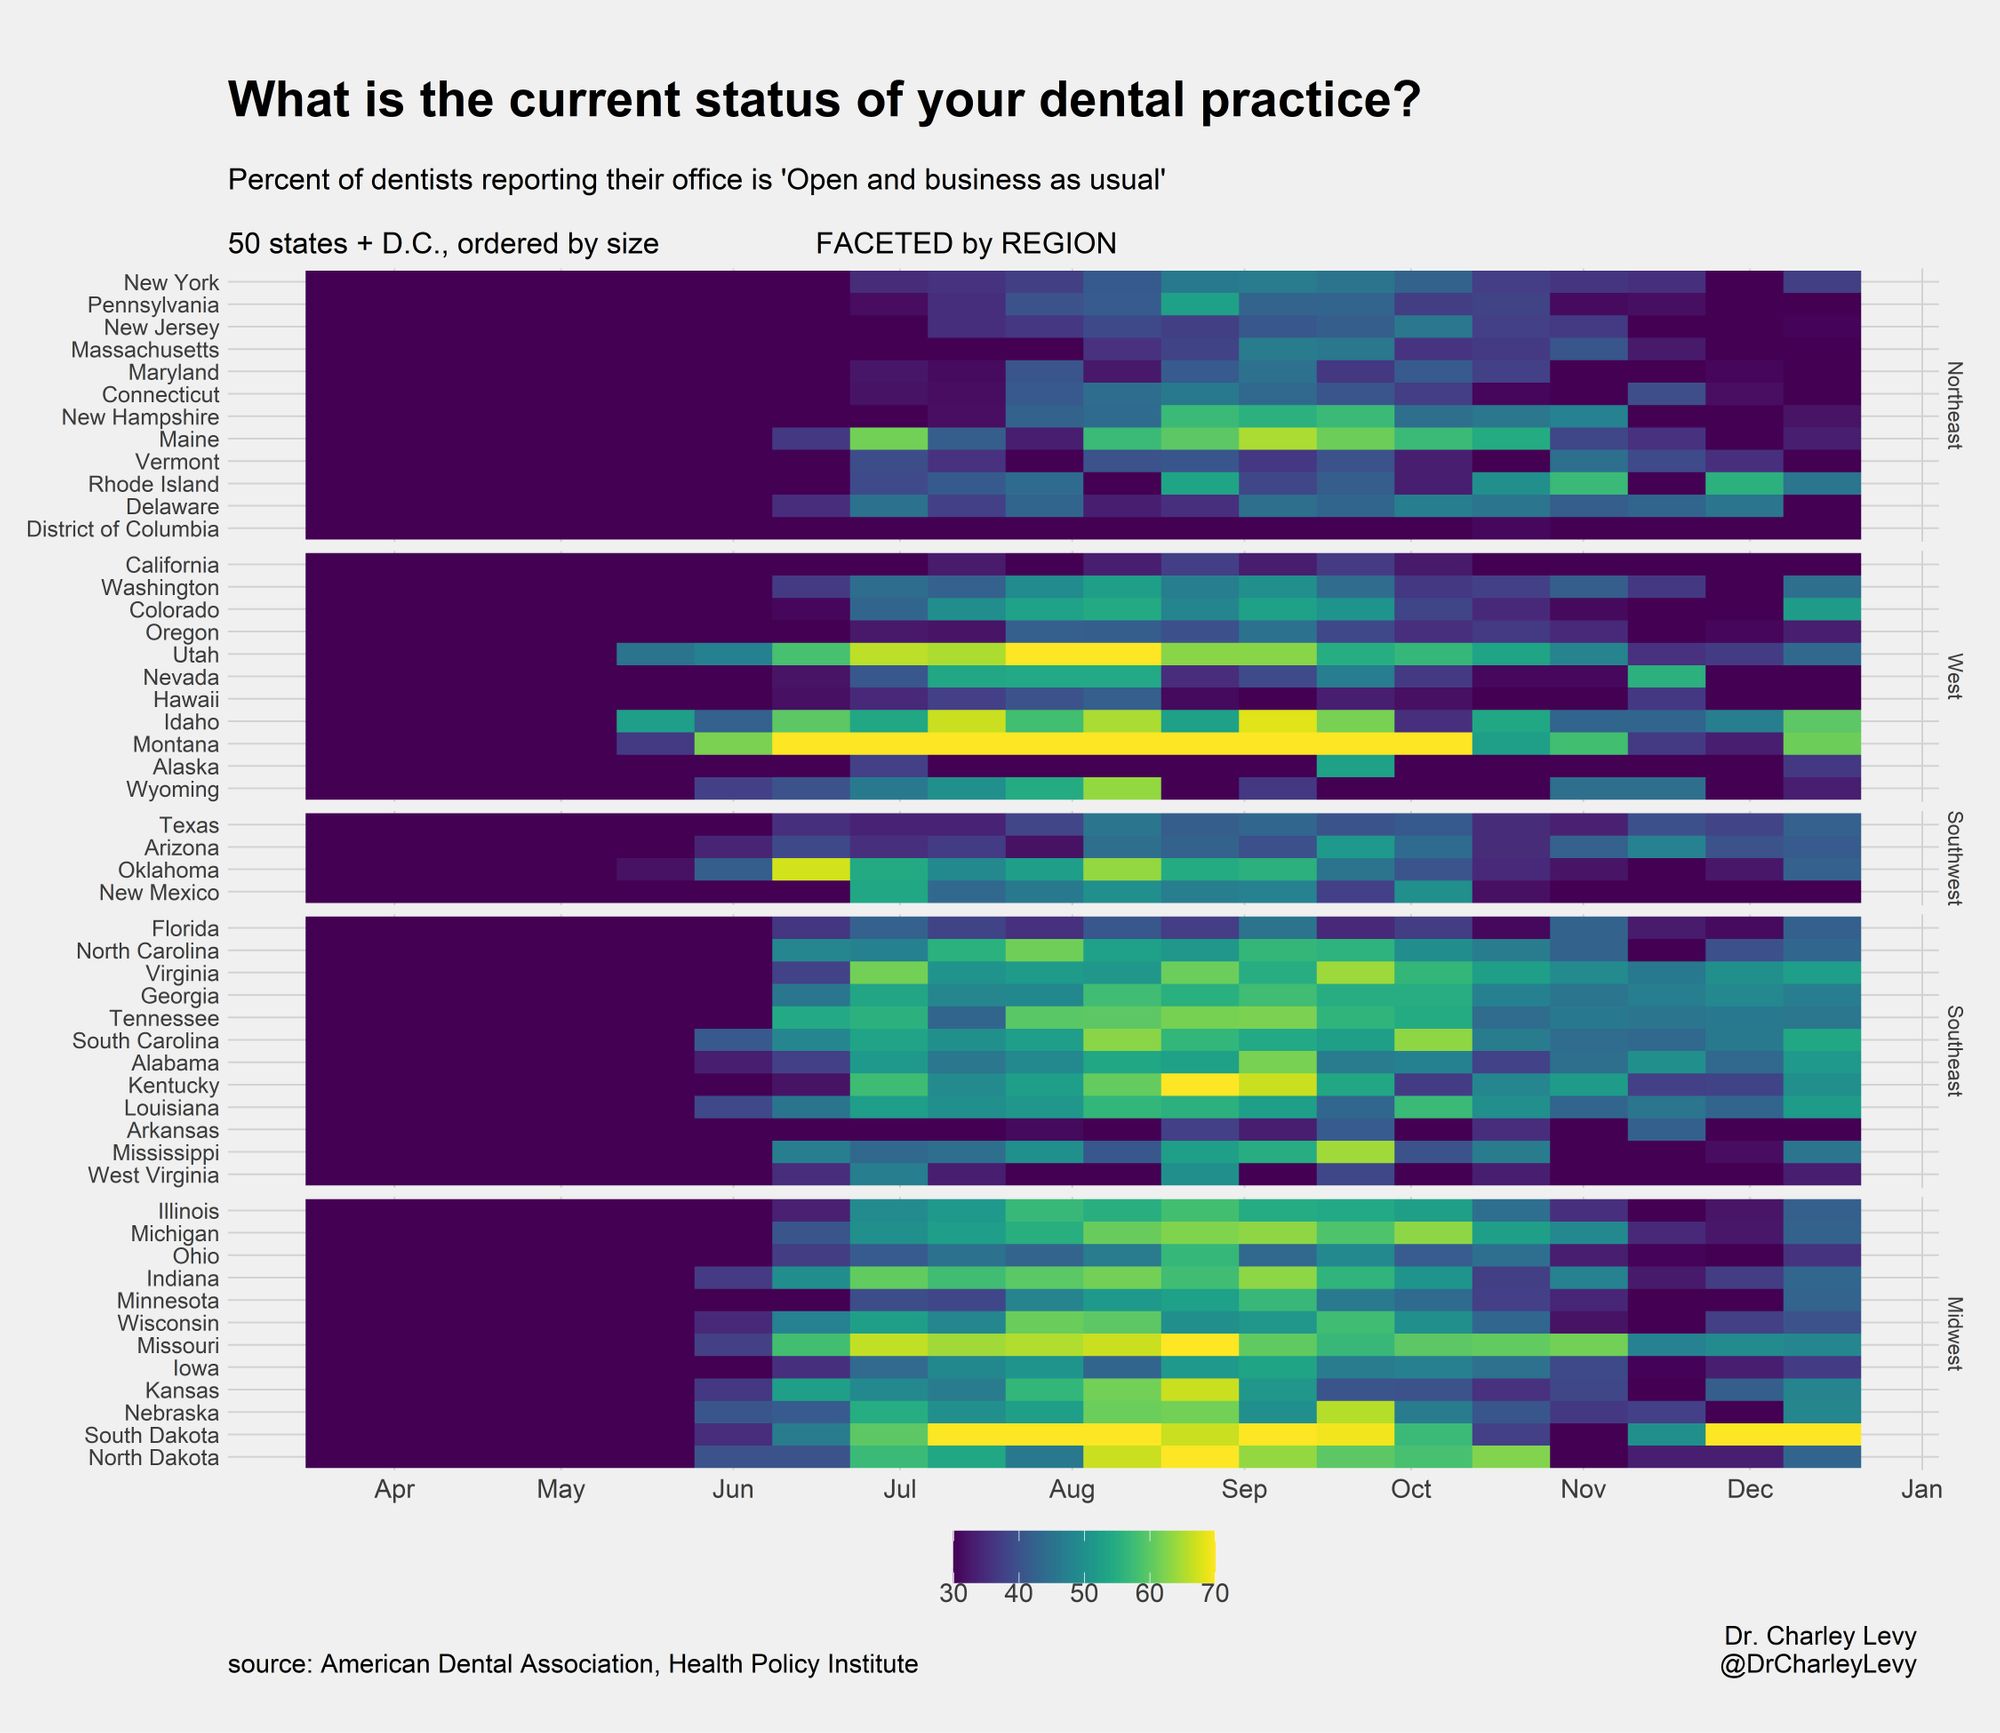
Measuring the recovery of the dental profession in each state
Scroll Down
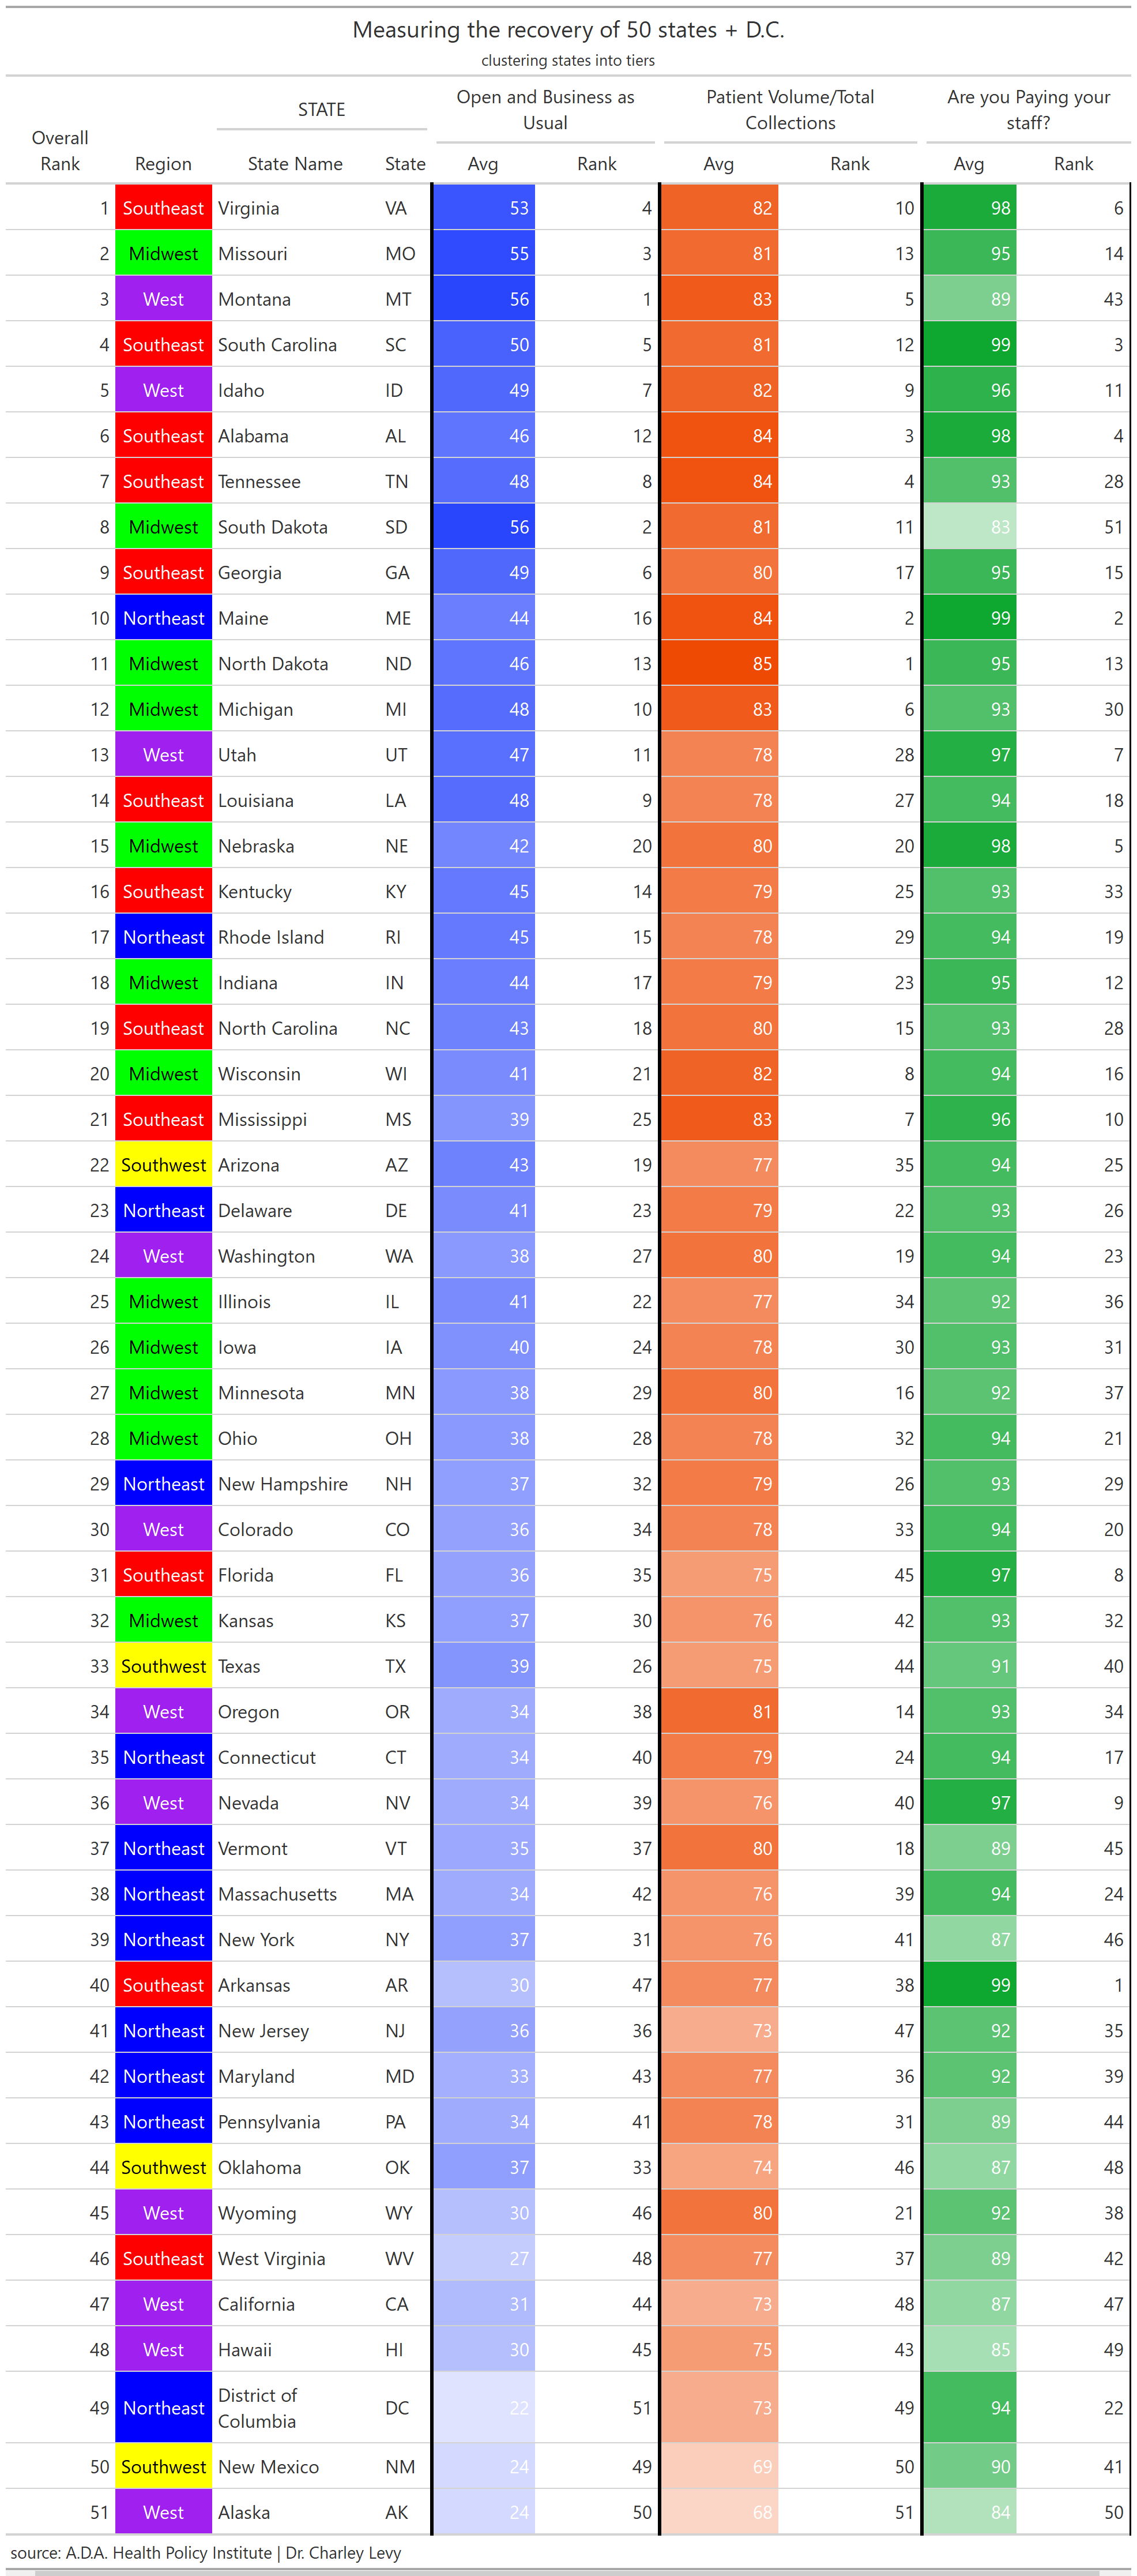
Group the 50 states + D.C. into tiers based on their recovery during the fall and winter
Data: A.D.A. Health Policy Institute Covid-19 tracking poll
Dates: September 21st to December 14th. This encompasses the most recent 7 waves (14-20) of the bi-weekly tracking poll. The wording of certain questions was changed in-between waves 13 and 14 so this is a convenient starting date.
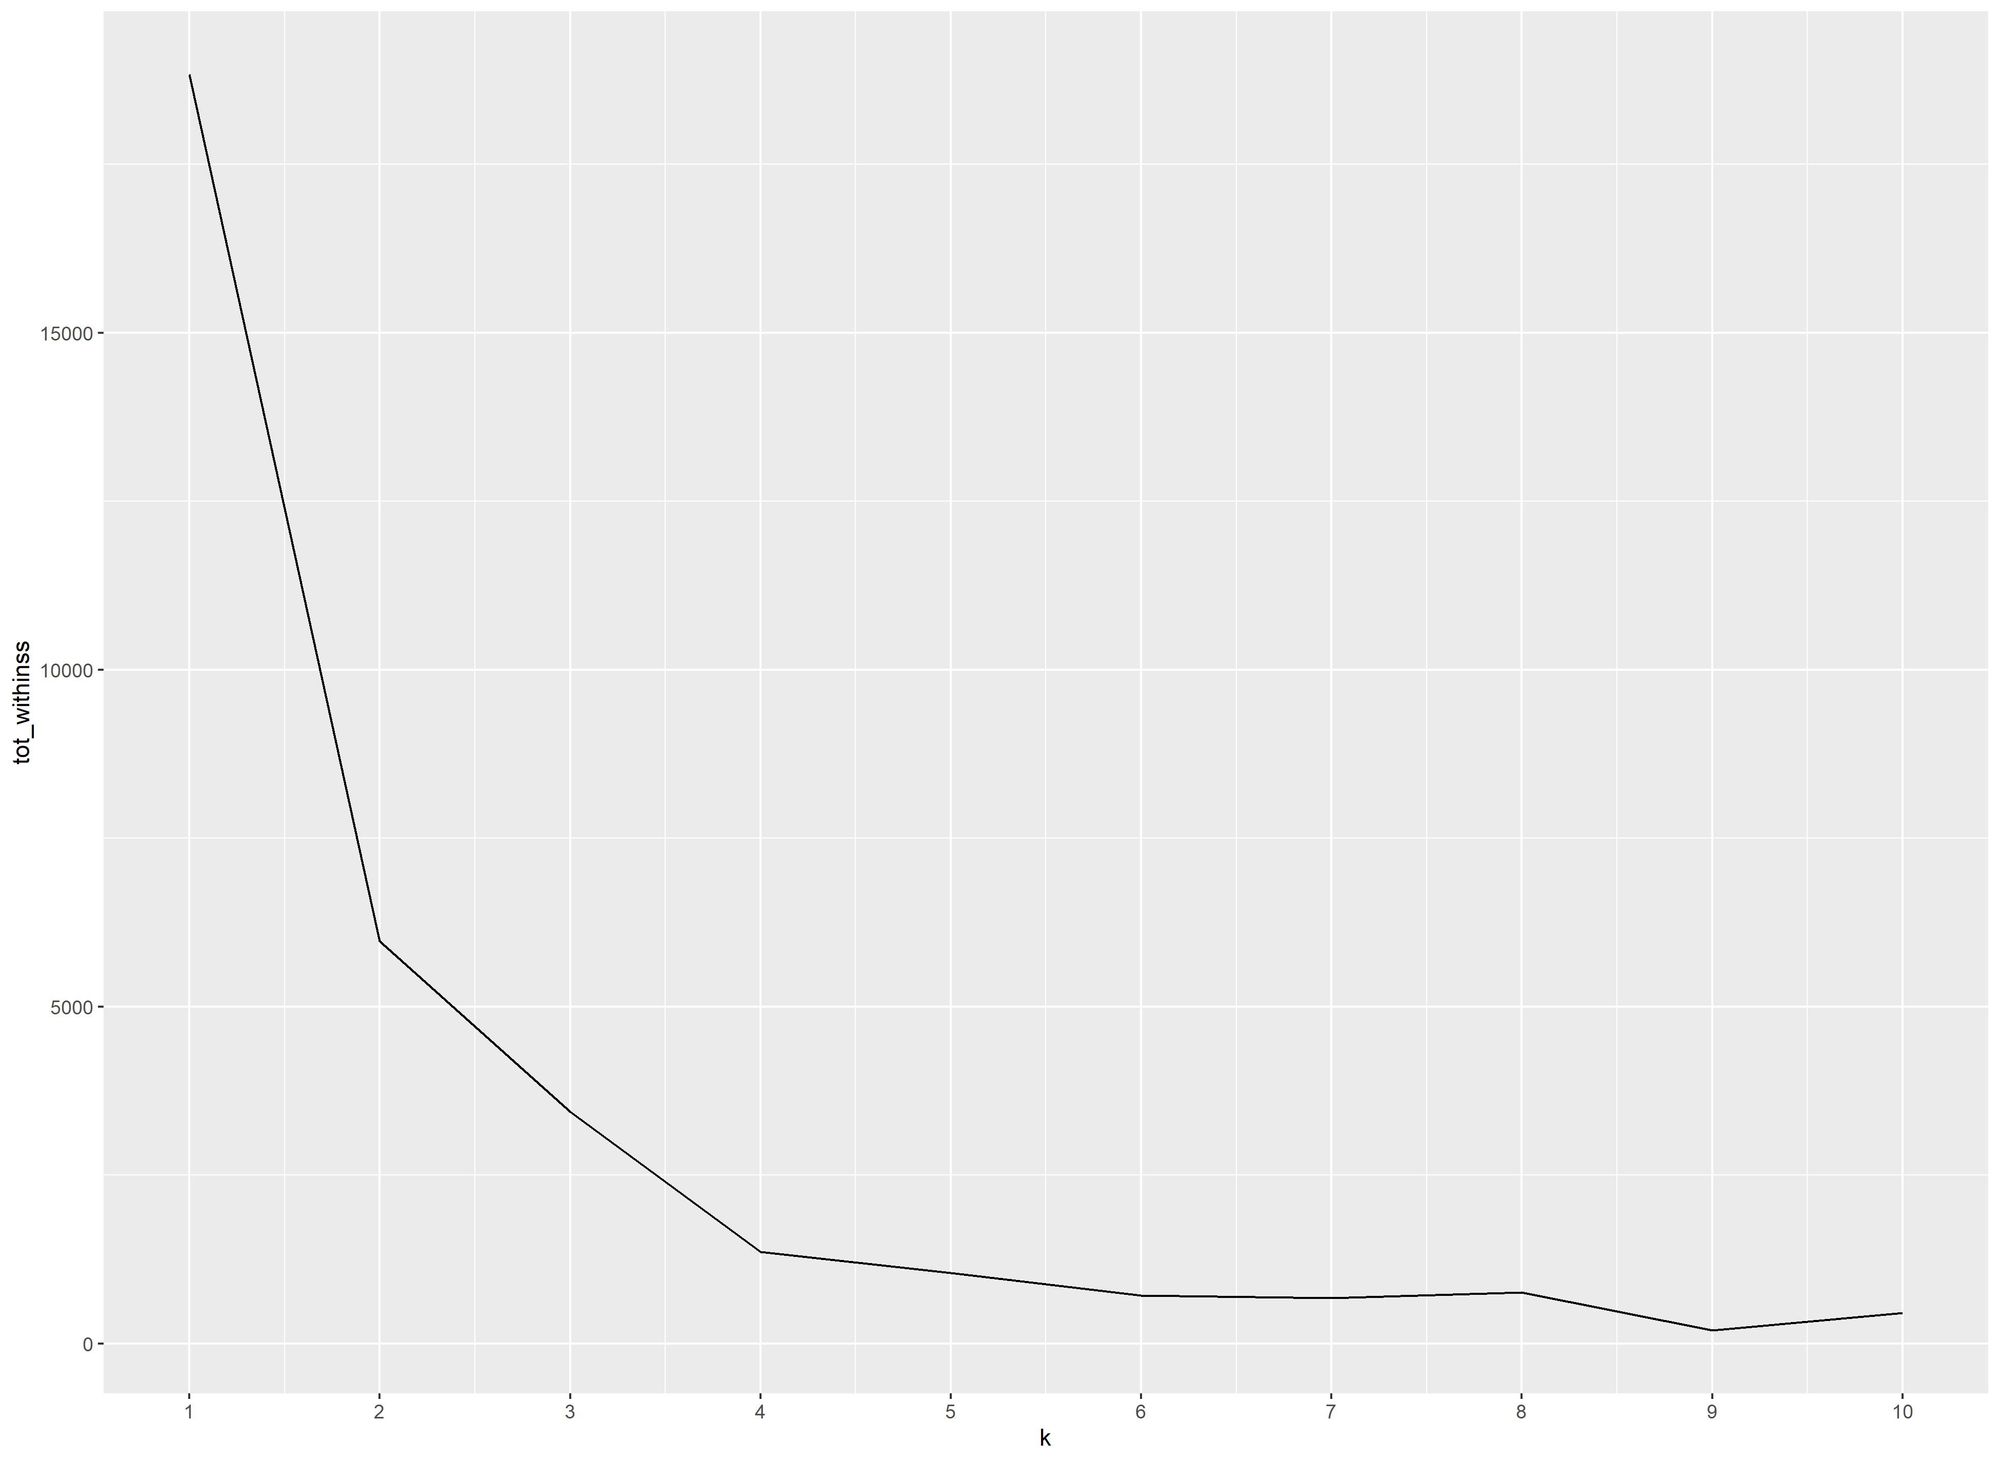
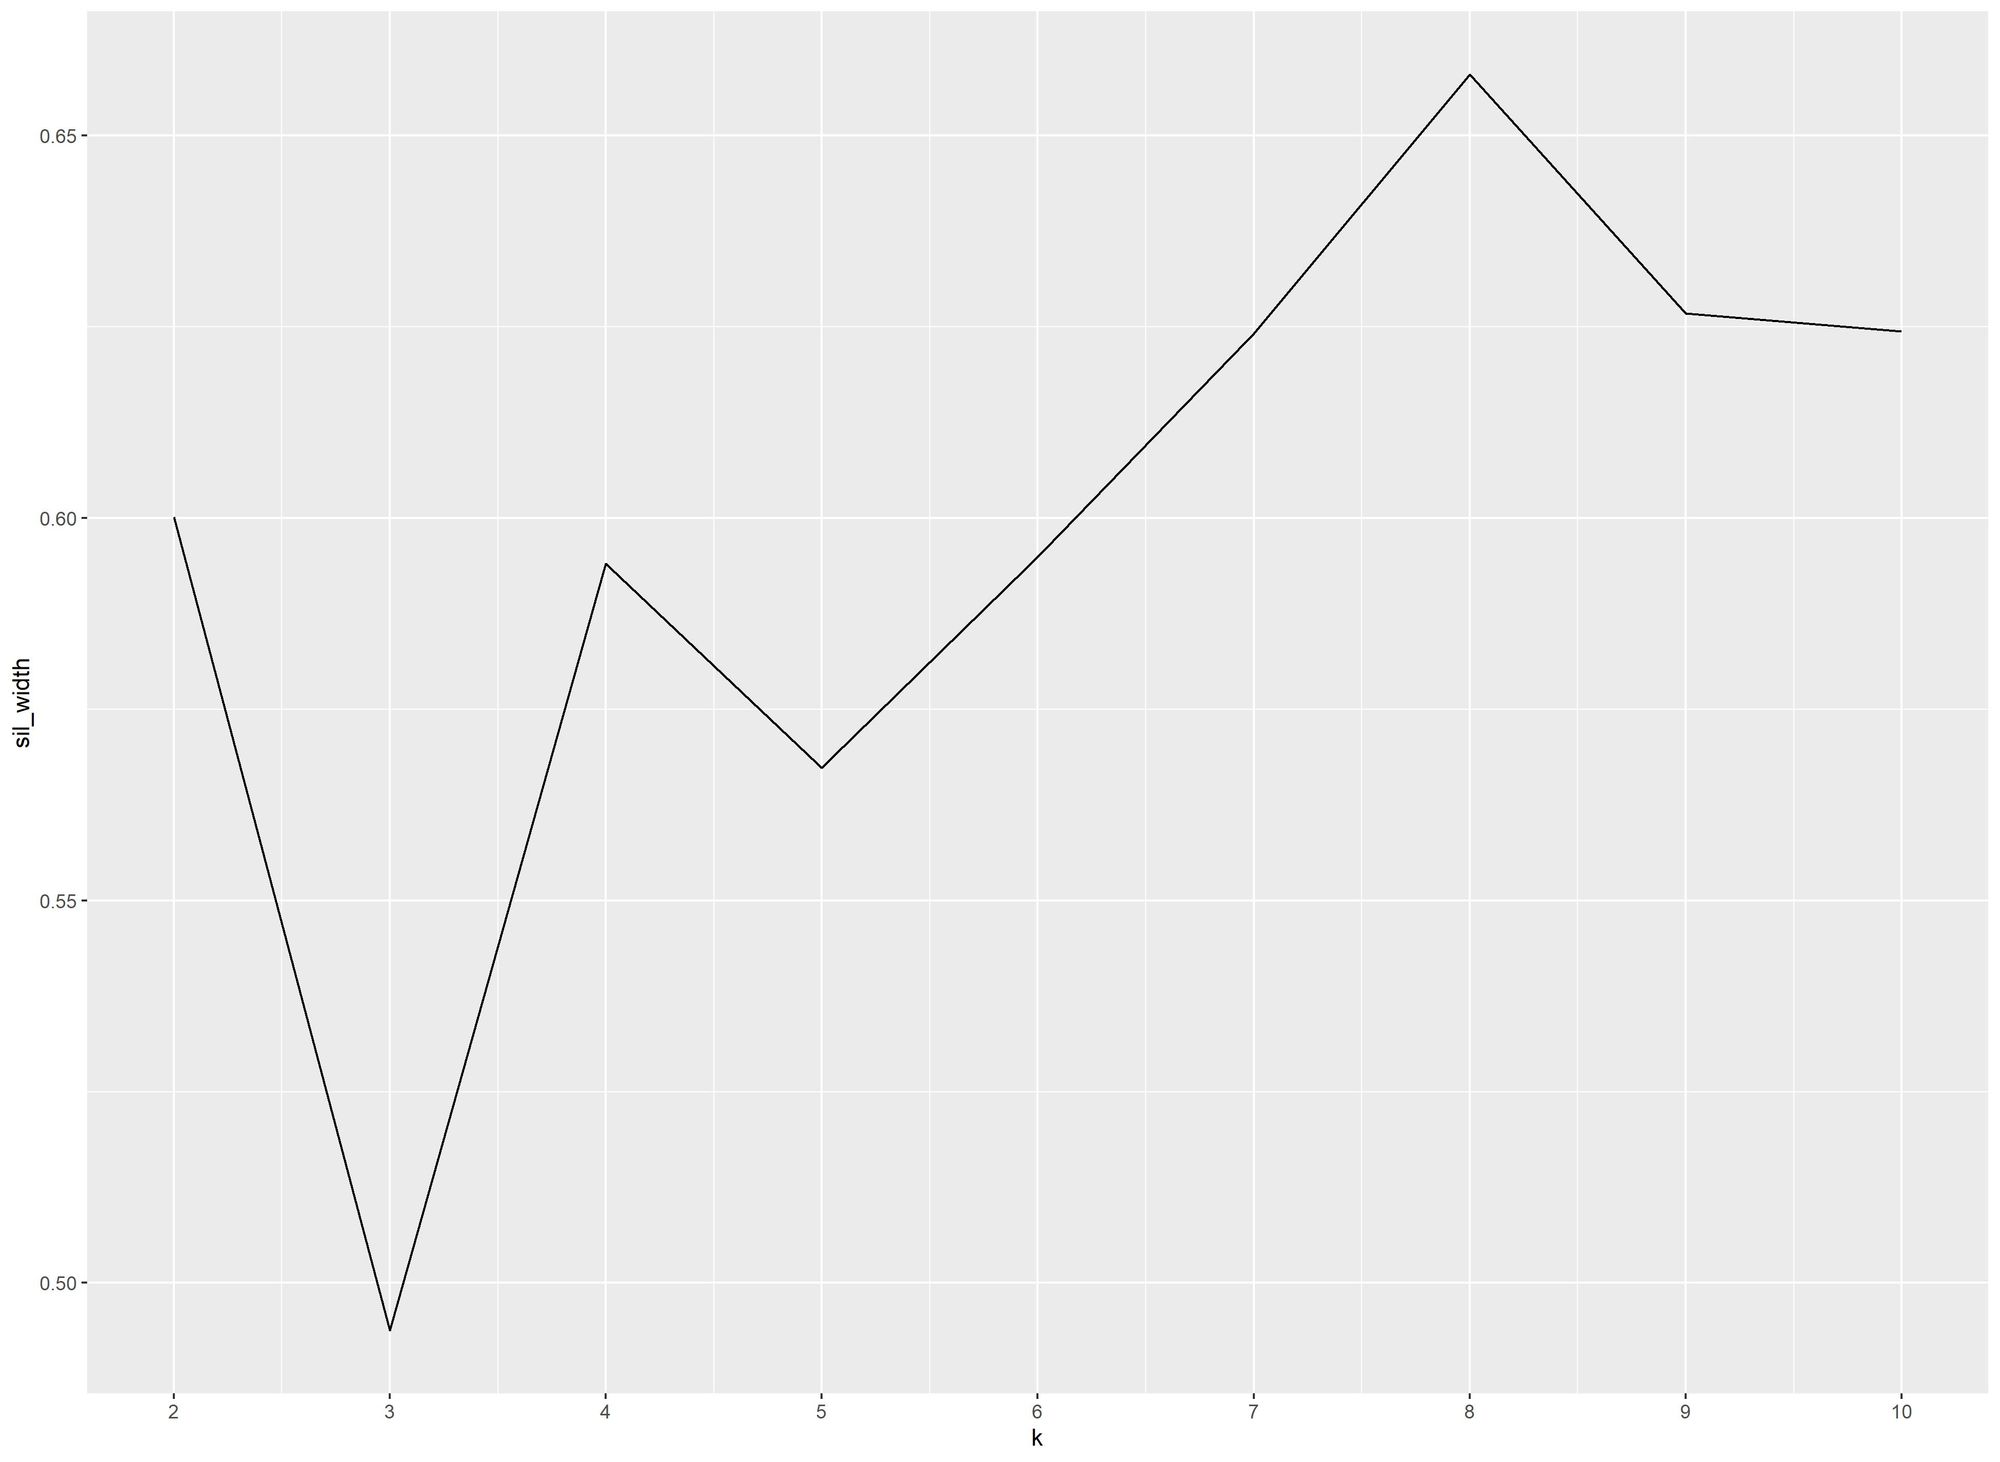
Method: average each state’s performance in the 4 main questions of the tracking poll over the last 7 waves. K-means clustering was used to find the appropriate number of clusters/tiers with-in the data. This is a form of unsupervised machine learning. For further analysis on Clustering method, please see Elbow Method and Silhouette Method plots in footnote.
Results: 4 tiers were found within the 50 states + D.C.
*a primer on the A.D.A.’s tracking poll can be read here
Tier 1 (14 states)- all about the Southeast and Midwest
This tier is dominated by the Southeast and Midwest. In our earlier exploration of the H.P.I.’s tracking poll, these 2 regions were found to be the best performing, so this is no surprise. 10 of the 14 states in this top tier reside in the Southeast (6) and Midwest (4). Three Western states (Utah, Idaho, Montana) made the top tier despite this region not performing well overall.
The results of the smaller states (less responses in the tracking poll…smaller sample sizes) always need to be viewed with caution. The geographic proximity of these 3 West states lends itself to the belief that this truly is a well performing pocket within the West. The lone Northeast state to make this top tier is Maine. Maine’s small sample size and significantly better results than all other states within the Northeast create skepticism to the true strength of it’s results.
Tier 2 (12 states)- more Southeast and Midwest
This second tier is also dominated by the Southeast and Midwest. 8 of the 12 states in this 2ndtier reside in the Southeast (3) and Midwest (5). The lone West state (Washington) and Southwest state (Arizona) to crack this 2nd tier share borders with the highly performing West states from the top tier. The Northeast states of Rhode Island and Delaware made this top tier. Rhode Island and Delaware (along with Maine in the 1st tier) are certainly outliers within their regions. Their small sample sizes are prone to statistical noise.
Tier 3 (19 states)- all about the Northeast and West
The largest tier is comprised of states that have faired poorly but have done distinctly better than the bottom tier. This tier is dominated by the Northeast and West. 8 of the 12 Northeast states reside in this below average tier. Of note, the 3 of the 4 largest states are in this tier (New York, Texas, Florida).
Tier 4 (6 states)- the West
This bottom tier had a significant drop off from tier 3. These 6 states have faired very poorly in their recovery over the fall and winter. Half of this tier is comprised of West states: the most populous California along with the non-contiguous states of Alaska and Hawaii.
Footnote: Elbow Method plot and Silhouette Method plot
Comments